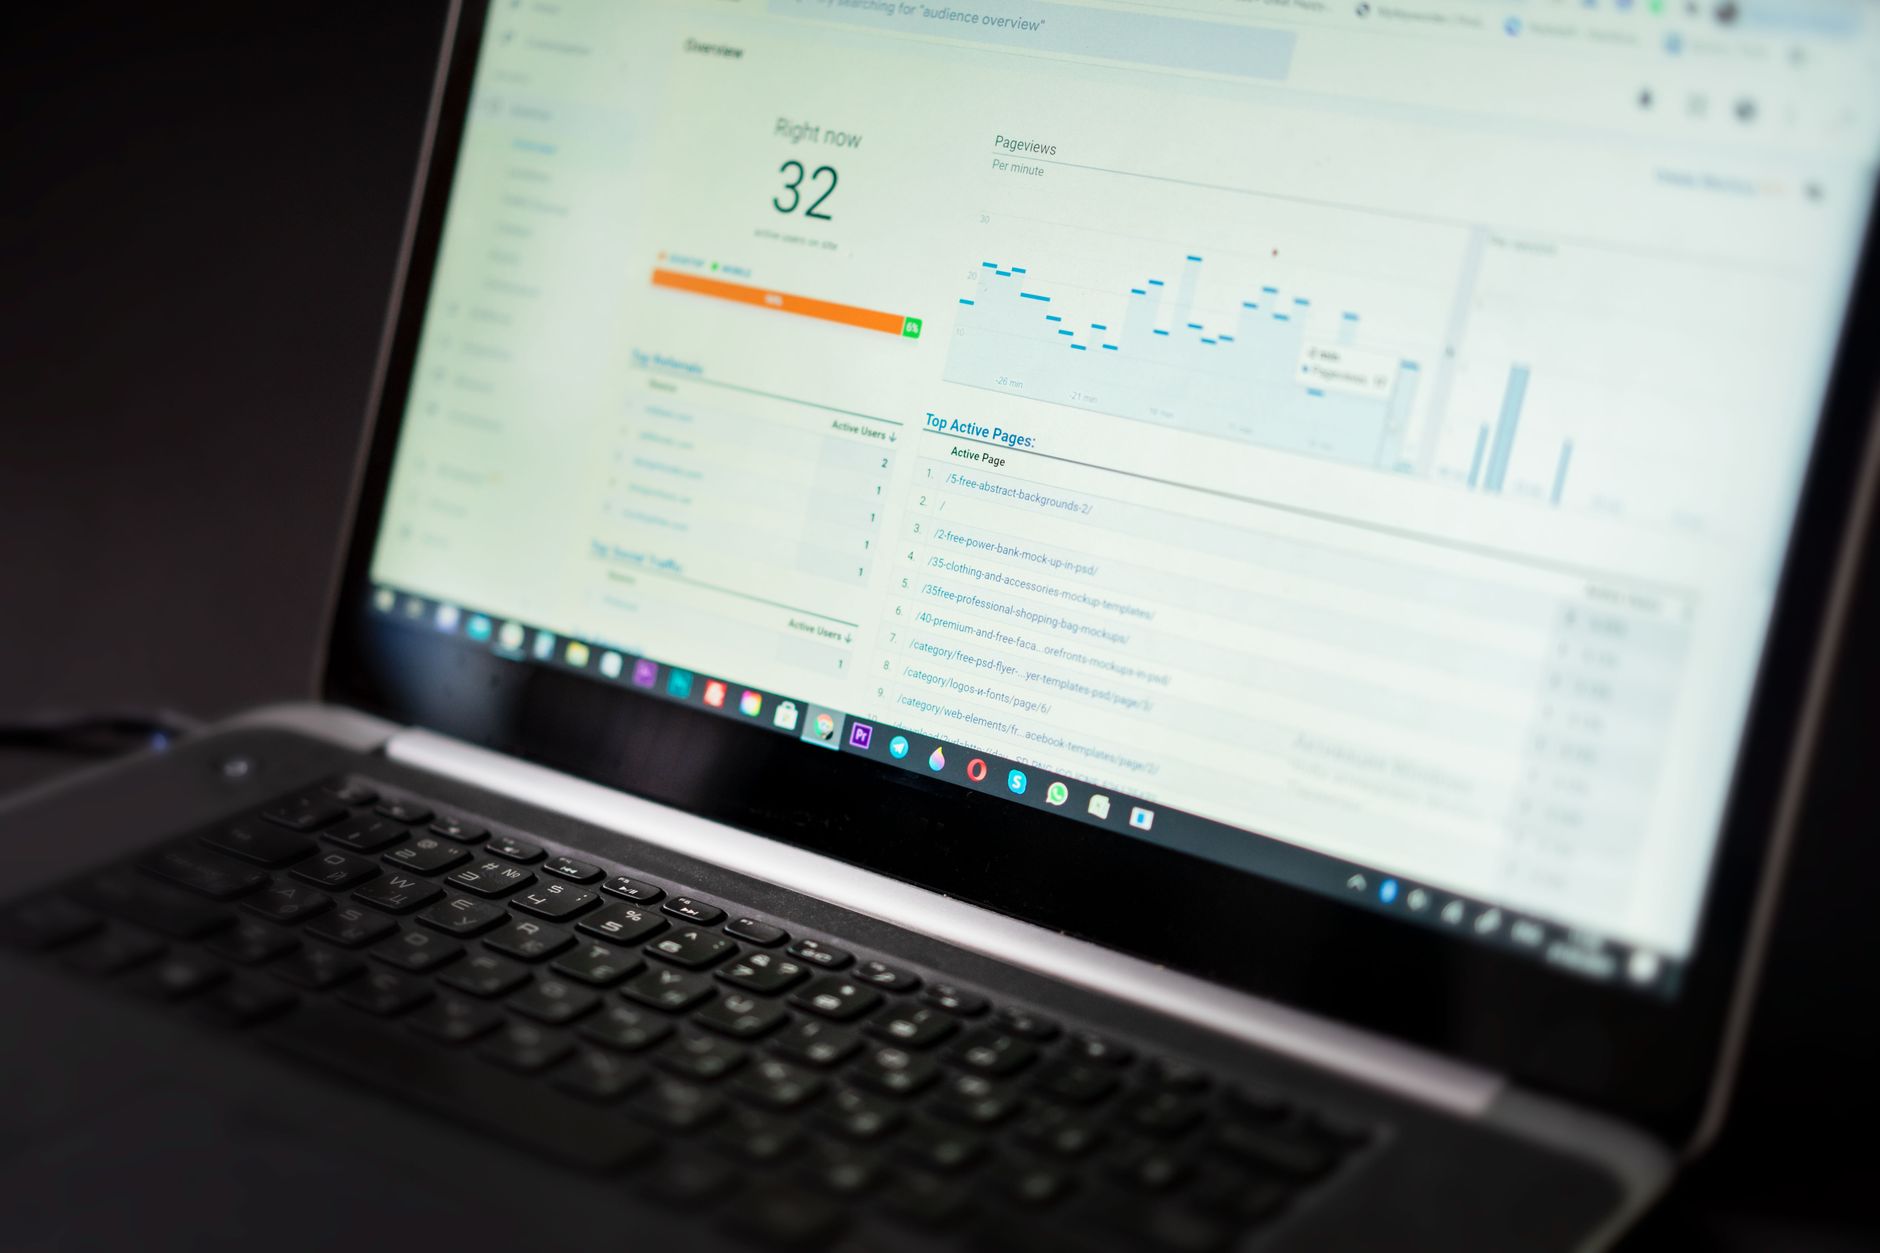
Automated Reporting Pipelines: Build API Dashboards & LLM Alerts
Learn how to build enterprise-grade automated reporting pipelines by connecting SEO APIs, generating AI-driven weekly commentary, and setting up real-time anomalies.

Previously in this course, we examined how to extract and process performance metrics using SQL and data warehousing as covered in BigQuery for Enterprise SEO: SQL and Reporting Guide. This lesson moves from static SQL queries and manual slide decks to fully real-time, automated executive reporting pipelines.
Manual SEO reporting is a massive drain on engineering and marketing resources. Pulling CSVs from Google Search Console, stitching them with GA4 exports, and writing manual commentary every Monday morning does not scale for enterprise sites.
To run an enterprise search program effectively, you need an end-to-end automated reporting pipeline. This system must ingest API data continuously, process it for anomalies, synthesize weekly performance commentary via LLM integration, and push actionable insights directly to executive dashboards.
Architecture of an API-Connected SEO Dashboard
An enterprise reporting pipeline consists of three core layers: Ingestion, Transformation/Storage, and Presentation/Action.
[ GSC / GA4 / Log APIs ] ---> [ Python Worker / Airflow ] ---> [ BigQuery Warehouse ]
                                                                      │
                                          ┌───────────────────────────┴───────────────────────────┐
                                          ▼                                                       ▼
                            [ LLM Commentary Generator ]                         [ Anomaly Detection Script ]
                                          │                                                       │
                                          └───────────────────────────┬───────────────────────────┘
                                                                      ▼
                                                       [ Slack Alerts & Looker Studio ]
Instead of relying on native connector plugins that break or hit rate limits, enterprise architectures use serverless functions or containerized Python scripts scheduled via cron or Apache Airflow to pull data directly via APIs.
Pulling Data via Python and Official APIs
To build an API-connected dashboard, you first need a reliable ingestion script. Below is a production-grade Python script that authenticates with the Google Search Console API, extracts performance data for a given property, and loads it directly into a data warehouse or local staging structure.
PYTHONimport os
from googleapiclient.discovery import build
from google.oauth2 import service_account
import pandas as pd
from datetime import datetime, timedelta

def fetch_gsc_data(service_account_file, property_uri, days_back=7):
    SCOPES = [CE9178">'https://www.googleapis.com/auth/webmasters.readonly']
    creds = service_account.Credentials.from_service_account_file(
        service_account_file, scopes=SCOPES
    )
    service = build(CE9178">'searchconsole', CE9178">'v1', credentials=creds)

    end_date = datetime.now() - timedelta(days=3) # GSC data latency buffer
    start_date = end_date - timedelta(days=days_back)

    request = {
        CE9178">'startDate': start_date.strftime(CE9178">'%Y-%m-%d'),
        CE9178">'endDate': end_date.strftime(CE9178">'%Y-%m-%d'),
        CE9178">'dimensions': [CE9178">'query', CE9178">'page', CE9178">'country', CE9178">'device'],
        CE9178">'rowLimit': 25000
    }

    response = service.searchanalytics().query(
        siteUrl=property_uri, body=request
    ).execute()

    rows = response.get(CE9178">'rows', [])
    data = []
    for row in rows:
        data.append({
            CE9178">'query': row[CE9178">'keys'][0],
            CE9178">'page': row[CE9178">'keys'][1],
            CE9178">'country': row[CE9178">'keys'][2],
            CE9178">'device': row[CE9178">'keys'][3],
            CE9178">'clicks': row[CE9178">'clicks'],
            CE9178">'impressions': row[CE9178">'impressions'],
            CE9178">'ctr': row[CE9178">'ctr'],
            CE9178">'position': row[CE9178">'position'],
            CE9178">'date': start_date.strftime(CE9178">'%Y-%m-%d')
        })

    return pd.DataFrame(data)

# Example execution in a scheduled pipeline worker
if __name__ == "__main__":
    df = fetch_gsc_data(os.getenv("GSC_CREDENTIALS_PATH"), "https://www.example.com/")
    print(f"Successfully extracted {len(df)} rows from Search Console API.")
Once this script runs inside your orchestration environment, the resulting DataFrame is appended to your cloud data warehouse, feeding downstream visualization layers like Looker Studio or Tableau without manual intervention.
Automating Weekly Performance Commentary via LLM Integration

Raw charts do not explain why traffic dropped 14% on a Tuesday. Executives want context, attribution, and recommended fixes. By connecting your structured reporting database to a Large Language Model via API, you can generate rigorous weekly performance summaries automatically.
Constructing the LLM Prompt Pipeline
To prevent hallucinations, your pipeline must feed pre-aggregated, deterministic delta metrics into the LLM prompt rather than asking the model to explore raw data.
- Calculate Deltas: Compare current week performance against the prior week and year-over-year.
- Isolate Outliers: Filter for top-gaining and top-losing URLs and queries.
- Inject Context: Pass these structured JSON summaries into a system prompt engineered for enterprise SEO analysis.
PYTHONimport openai
import json

def generate_seo_commentary(aggregated_metrics_json):
    client = openai.OpenAI(api_key=os.getenv("OPENAI_API_KEY"))

    system_prompt = (
        "You are an elite enterprise SEO director. Analyze the provided weekly performance JSON "
        "and write a 3-bullet executive summary. Highlight the primary driver of traffic shifts, "
        "any cannibalization or technical anomalies detected, and a recommended action item. "
        "Keep the tone concise, professional, and entirely factual based on the data provided."
    )

    response = client.chat.completions.create(
        model="gpt-4o",
        messages=[
            {"role": "system", "content": system_prompt},
            {"role": "user", "content": json.dumps(aggregated_metrics_json)}
        ],
        temperature=0.2
    )

    return response.choices[0].message.content
This generated commentary is automatically appended to your executive dashboard header or sent via webhook to your leadership Slack channel every Monday at 6:00 AM UTC.
Creating Automated Anomaly Detection Alerts
Waiting for a monthly review to catch a catastrophic indexation failure or accidental noindex deployment is fatal to revenue. You need real-time anomaly detection running continuously against your traffic streams.
Statistical Process Control (Z-Score & IQR)
We can identify true anomalies by measuring standard deviations (Z-score) against a rolling 30-day baseline. If daily organic clicks drop below a threshold of $3.5$ standard deviations from the moving average, an automated alert fires.
PYTHONimport numpy as np
import pandas as pd

def detect_anomalies(df_daily_traffic):
    CE9178">"""
    df_daily_traffic must contain columns: [CE9178">'date', CE9178">'clicks']
    sorted chronologically.
    """
    df = df_daily_traffic.copy()
    df[CE9178">'rolling_mean'] = df[CE9178">'clicks'].rolling(window=30, min_periods=15).mean()
    df[CE9178">'rolling_std'] = df[CE9178">'clicks'].rolling(window=30, min_periods=15).std()

    # Calculate Z-Score
    df[CE9178">'z_score'] = (df[CE9178">'clicks'] - df[CE9178">'rolling_mean']) / df[CE9178">'rolling_std']

    # Flag anomalies where clicks drop more than 3 standard deviations
    anomalies = df[df[CE9178">'z_score'] < -3.0]
    return anomalies
When an anomaly is flagged, your script should immediately capture the affected directories, query segments, and server log samples, formatting them into an emergency webhook payload sent directly to your engineering team's alerting channel.
Hands-on Exercise
Goal: Build a basic Python monitoring script that checks for sudden click drops and dispatches an alert.
- Set up a local Python environment with
pandas,requests, andgoogle-api-python-client. - Write a script that pulls the last 35 days of aggregate GSC clicks for a test property.
- Implement the rolling Z-score anomaly detection function shown above.
- Configure a mock webhook (using a free service like Webhook.site) to receive the JSON payload whenever a Z-score drops below
-2.5.
Common Pitfalls
- Ignoring API Quota Limits: Querying GSC or GA4 APIs at too high a frequency or without proper batching will trigger rate-limit blocks (HTTP 429). Always implement exponential backoff retry logic.
- Failing to Account for Seasonality: Standard rolling averages will misidentify holiday dips (like Christmas or Thanksgiving) as traffic anomalies. Ensure your baseline accounts for day-of-week and holiday calendar adjustments.
- Blindly Trusting LLM Commentary: Without strict temperature constraints and pre-filtered numeric inputs, models can hallucinate causes for traffic shifts. Always use structured JSON metrics as the single source of truth.
Recap

Automated reporting pipelines transform SEO from a reactive guessing game into an engineering discipline. By combining direct API data ingestion, automated LLM-driven executive commentary, and statistical anomaly detection, your team gains real-time visibility and absolute control over enterprise search performance.
Up next in the course: SEO Performance Forecasting — where we build seasonality-adjusted traffic models and project the revenue impact of enterprise initiatives.
Work with me

AI Automation & Agentic Workflow Development
Automate the repetitive work eating your time — content pipelines, data workflows, and agentic AI tasks that run themselves.
CI/CD Pipeline & Docker Containerization
Ship with confidence: automated CI/CD pipelines and Docker setups so every push is tested and deployed — no more manual, error-prone releases.