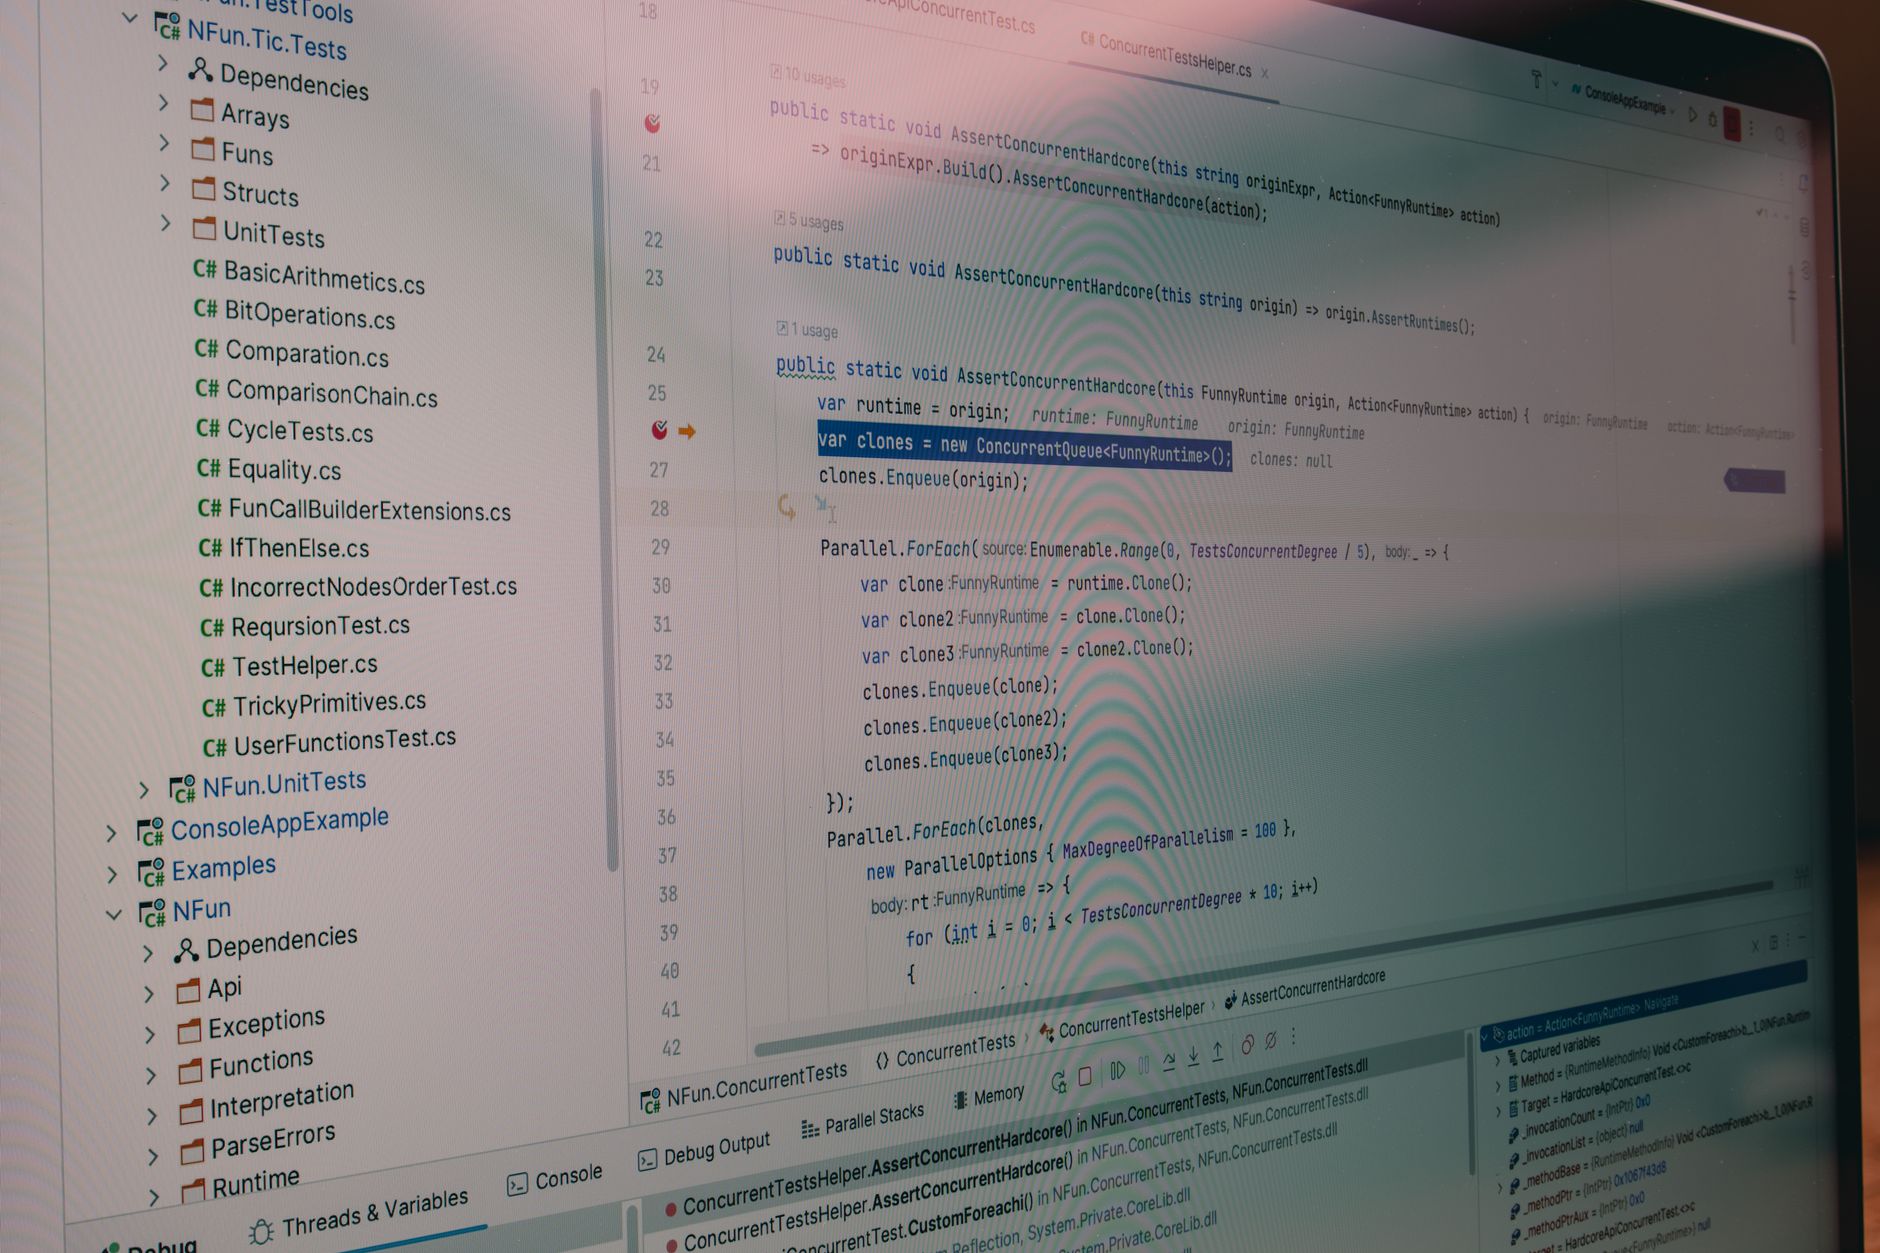
Understanding Code Coverage: Metrics, Reporting, and Reality
Learn how to use code coverage to identify gaps in your test suite, generate meaningful reports, and avoid the common trap of chasing 100% metrics.

Previously in this course, we discussed Automated Gatekeeping: Stop Broken Code Before It Merges, where we configured our CI pipeline to block code that fails tests. Now that we have a functional gate, we need a way to measure the "depth" of that gate: how much of our logic is actually being exercised? This lesson introduces code coverage as a diagnostic tool for your test suite.
What is Code Coverage?
Code coverage is a measurement used to describe the degree to which the source code of a program is executed when a particular test suite runs. It’s not a measure of quality—it’s a measure of visibility.
When you run your tests with coverage enabled, the tool instruments your code, tracking which lines, branches, and functions are hit during execution. If a line of code is never touched by your tests, the coverage tool flags it as "uncovered."
Generating Coverage Reports
Most modern languages have mature tooling for this. In Python, for example, we use pytest-cov.
To generate a report, you typically install the plugin and run your tests with a specific flag. Assuming you have your Organizing Test Suites: A Guide to Clean Code and Maintainability structure in place, you would run:
Bash# Install the reporting tool
pip install pytest-cov

# Run tests and generate a terminal report
pytest --cov=my_project tests/
This will output a table in your terminal showing the coverage percentage per file. For a more visual experience, you can generate an HTML report:
Bashpytest --cov=my_project --cov-report=html tests/
Opening the generated htmlcov/index.html file in your browser allows you to click into specific files. Lines that were executed appear in green; lines that were skipped appear in red.
Identifying Uncovered Code Paths
The true power of these reports isn't the final percentage; it’s the "red lines." When you inspect a report, look for:
- Unreachable Code: Sometimes you'll find code that is logically impossible to reach. This is often dead code that should be deleted.
- Missing Edge Cases: If an
ifstatement has anelseblock that is highlighted in red, you have missed an entire branch of logic. This is an immediate sign that your Refactoring with Confidence: A Guide to Safe Code Restructuring efforts might be missing a safety net. - Complex Logic: If a complex function has low coverage, it’s a strong signal that the code is too tightly coupled or contains too many responsibilities, making it hard to test in isolation.
The Limits of Coverage Metrics
A common pitfall is treating "100% code coverage" as the ultimate goal. It is not.
| Metric Type | What it tells you | What it ignores |
|---|---|---|
| Line Coverage | Did this line execute? | Did it execute with the right data? |
| Branch Coverage | Did all if/else paths execute? | Did we test all logical combinations? |
| Path Coverage | Did every possible flow execute? | Does the output actually match intent? |
You can have 100% line coverage and still have a buggy application. If your test calls a function but doesn't actually assert the results (the "empty test" problem), the coverage tool will mark the line as "covered" because it was executed, even though the test verified nothing.
The Golden Rule: Coverage is a tool for finding what you haven't tested, not a proof of correctness.
Hands-on Exercise
- Pick a function in your current project that contains an
ifstatement. - Run your current test suite with
pytest --cov=your_module. - Open the HTML report and check if both the
ifandelsebranches are green. - If one is red, write a new test case specifically designed to trigger that missing branch.
- Re-run the report and verify the color shift.
Common Pitfalls
- Chasing 100%: Aiming for 100% coverage often leads to writing tests that verify the implementation details rather than the behavior. This makes your tests fragile during refactoring.
- Ignoring Integration Paths: Coverage tools usually focus on unit tests. Remember that your integration tests also contribute to the health of the system.
- The "Assert-less" Trap: As mentioned, executing code without meaningful assertions provides a false sense of security. Always ensure your tests are verifying values, not just "hitting lines."
Recap
Code coverage is a diagnostic map of your codebase. Use it to find hidden blind spots, dead code, and unexercised branches. But remember: a high percentage is a vanity metric; a high-quality test suite that actually asserts correct behavior is the real objective.
Up next: Improving Test Coverage through targeted strategy and branch analysis.
Work with me

AI Automation & Agentic Workflow Development
Automate the repetitive work eating your time — content pipelines, data workflows, and agentic AI tasks that run themselves.

Next.js Website & Landing Page Development
A blazing-fast, SEO-optimized website or landing page in Next.js — the kind that loads instantly and ranks. Design-to-code, done right.