Using IDE Breakpoints: Mastering Runtime Inspection for Debugging
Learn to use IDE breakpoints to pause execution and inspect your application's state in real-time, moving beyond basic logging to professional debugging.
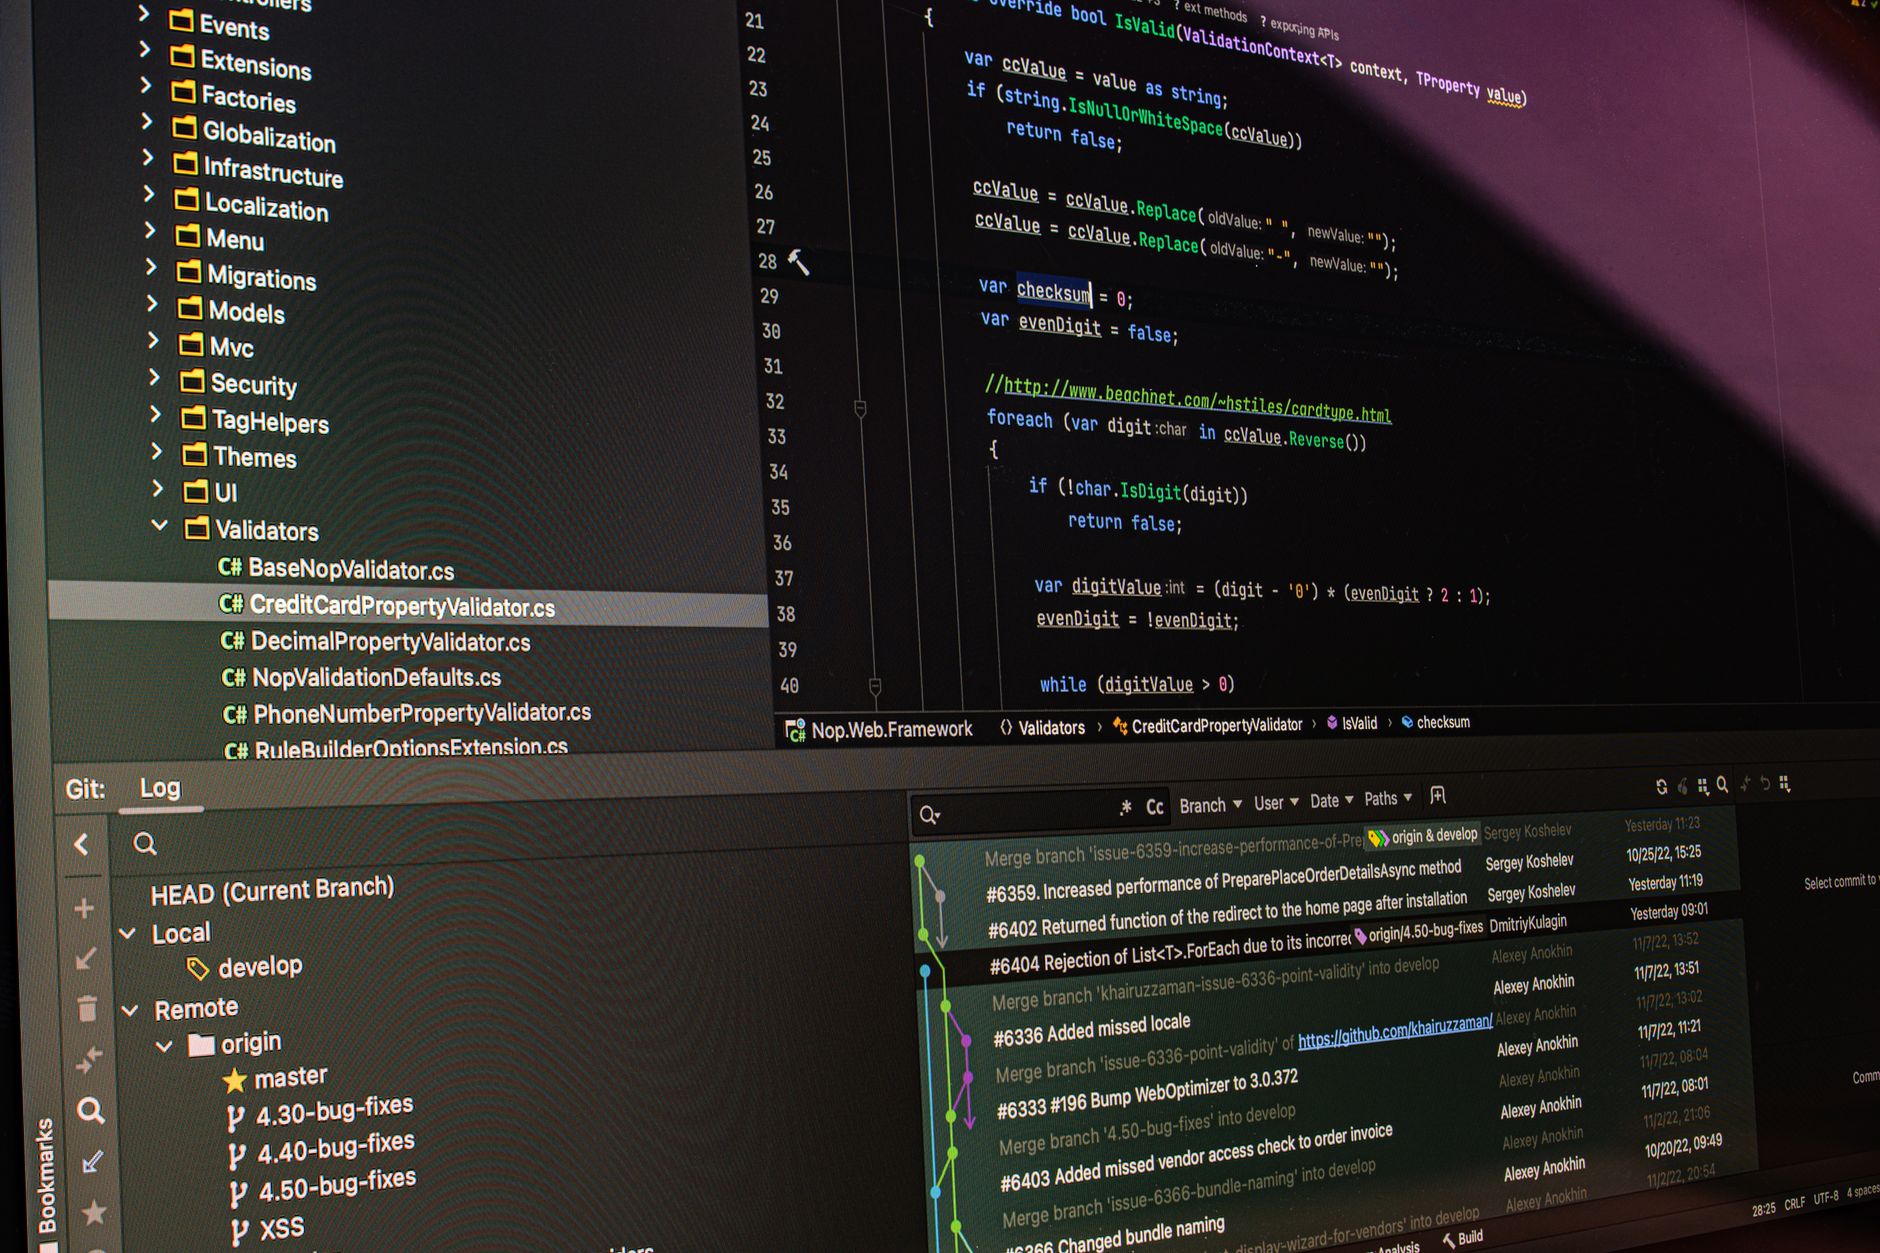
Previously in this course, we explored The Scientific Method of Debugging. While that lesson focused on formulating hypotheses, this lesson gives you the primary tool to test those hypotheses: IDE debugging.
When you rely solely on print or console.log statements, you are essentially "blind-debugging." You are guessing where the error might be, adding logs, running the code, and hoping the output reveals the truth. Breakpoints transform this process by allowing you to "freeze" time, letting you walk through your logic exactly as the computer executes it.
What is an IDE Breakpoint?
A breakpoint is a marker you place on a specific line of code that instructs your IDE (like VS Code, IntelliJ, or PyCharm) to pause the application's execution the moment it reaches that line.
When execution hits a breakpoint, the application doesn't crash; it enters a "suspended" state. At this point, the entire memory context—your variables, objects, and the current call stack—is frozen. This is the moment of runtime inspection. You aren't just looking at what the code should do; you are looking at what it is actually doing at that precise microsecond.
Setting Your First Breakpoint
In most modern IDEs, setting a breakpoint is as simple as clicking in the "gutter"—the narrow column to the left of your line numbers. A small red dot will appear.
Consider this simple function in our ongoing course project, which calculates a discount for our shopping cart:
PYTHONdef apply_discount(price, discount_percent):
    # Set a breakpoint on the next line
    multiplier = discount_percent / 100
    final_price = price - (price * multiplier)
    return final_price

# Usage
print(apply_discount(100, 20))
To debug this:
- Click the gutter next to
multiplier = discount_percent / 100. - Start your IDE’s debugger (usually by clicking the "Debug" icon or pressing
F5). - When the code runs, it will stop at that red dot.
- Your IDE will highlight the line, and a "Variables" or "Debug" panel will appear, showing you that
priceis100anddiscount_percentis20.
Observing Control Flow
Once you have paused execution, you are in control. The IDE provides a toolbar that allows you to steer the execution:
- Continue (Play): Resume execution until the next breakpoint.
- Step Over: Execute the current line and move to the next one in the current function.
- Step Into: If the current line contains a function call, jump inside that function.
By using "Step Over," you can watch the final_price variable change in the variable inspector as you move from line to line. If you suspected that the multiplier calculation was incorrect, you could pause exactly at the calculation line, inspect the inputs, and prove whether your assumption was correct.
Hands-on Exercise: The "Frozen" State
For this exercise, return to the project you initialized in Setting Up the Project Environment.
- Open a function that performs a calculation or a logic check (like a simple validator).
- Set a breakpoint at the start of that function.
- Run the application in "Debug" mode.
- Once the code pauses, look at the Variables window in your IDE. Identify three variables currently in scope.
- Use the "Step Over" button to move to the next line and observe which variable values update in the UI.
Common Pitfalls
Even experienced engineers trip up with breakpoints. Avoid these common mistakes:
- The "Infinite Loop" Trap: Don't place a breakpoint inside a loop that runs thousands of times unless you have a "Conditional Breakpoint." Most IDEs allow you to right-click the red dot and add a condition (e.g.,
i == 999), so the debugger only pauses when that specific iteration occurs. - Ignoring the Call Stack: Beginners often look only at the current function. If your variable looks wrong, don't just stare at the current line—look at the Call Stack window. It shows you the hierarchy of functions that led to the current state. Often, the bug isn't where you stopped; it's in the function that passed the bad data to you.
- Assuming Code is Immutable: You can often edit variables while the code is paused. This is incredibly useful for testing "what if" scenarios without restarting the entire program.
FAQ
Q: Does using a debugger slow down my computer? A: Yes, the debugger adds overhead. Your code will run slower, and that's normal. Never use a debugger in a production environment; it is strictly a local development tool.
Q: My breakpoint isn't being hit. Why?
A: Common reasons include: the code path isn't actually being executed (check your if statements), you are debugging the wrong process, or the file you are editing isn't the one being run.
Q: What is a "Conditional Breakpoint"? A: It is a feature where you define logic for the breakpoint. Instead of stopping every time, it only stops when a specific expression is true, saving you from clicking "Continue" a hundred times.
Recap
Breakpoints turn debugging from a guessing game into a surgical operation. By setting breakpoints, pausing execution, and inspecting runtime variables, you gain total visibility into your application's state. You now have the ability to move through your code line by line, ensuring that your mental model of the program matches reality.
Up next: Stepping Through Code, where we dive deeper into the mechanics of navigating logic flows using step-into, step-over, and step-out commands.
Work with me
Laravel Bug Fixes, Maintenance & Optimization
Stuck on a Laravel bug or a slow app? Fast, reliable fixes, upgrades, and performance tuning from an experienced Laravel engineer.
Next.js Full-Stack Web App Development
A fast, SEO-ready full-stack web app built with Next.js 16 — from idea to deployed product, by an engineer who ships to production.