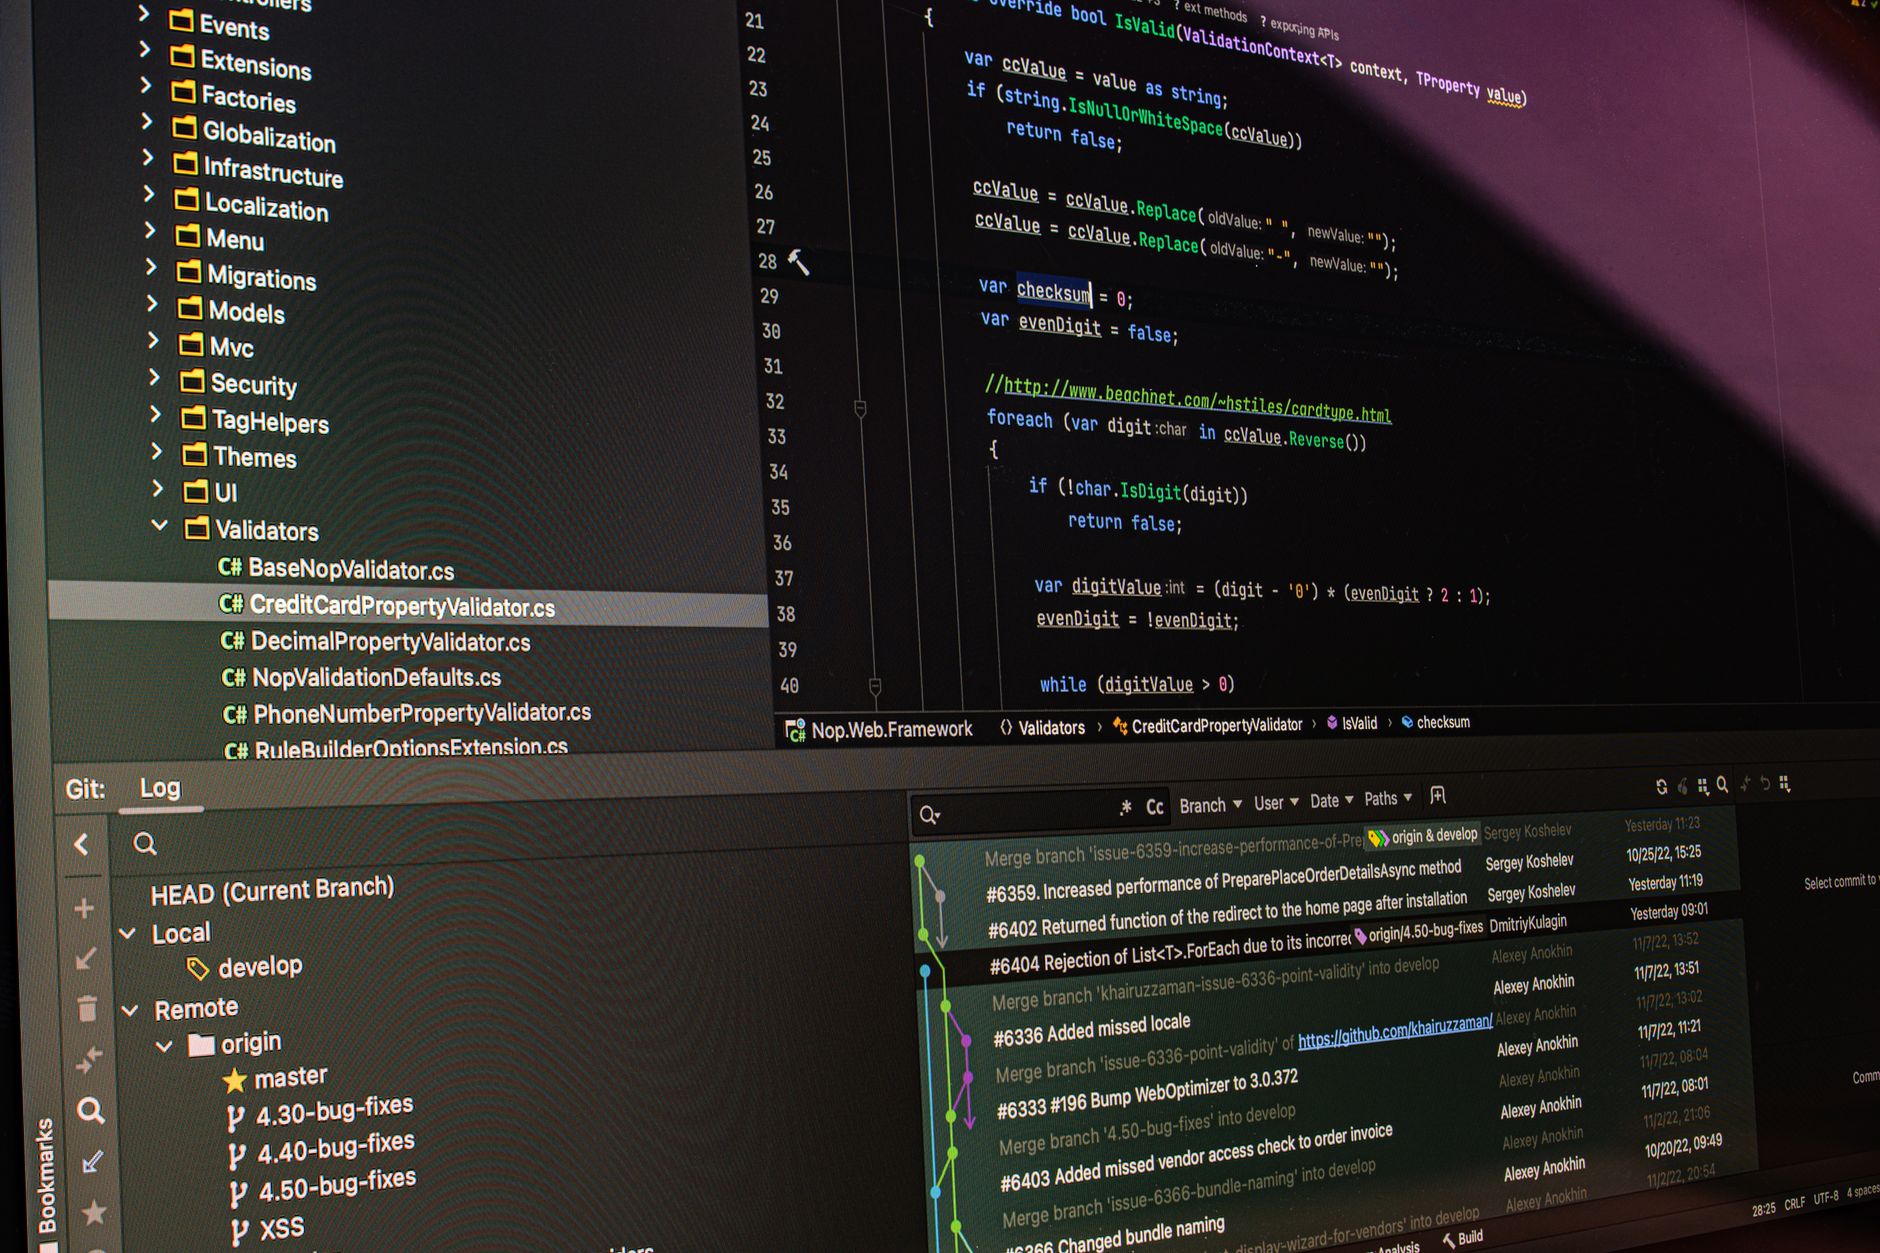
Utilizing Watch Windows: Mastering Real-Time Variable Monitoring
Learn how to use a watch window for effective variable monitoring and state tracking. Stop guessing values and start debugging your code with precision.

Previously in this course, we explored stepping through code to follow execution flow. While stepping is vital, it becomes tedious when you need to track how a specific variable changes across hundreds of loop iterations. This lesson introduces the watch window, a specialized debugger tool that allows you to observe state changes in real-time without manual intervention.
The Power of Variable Monitoring
When you pause execution at a breakpoint, your IDE’s "Variables" pane often shows too much information—most of which is irrelevant to the specific bug you are hunting. A watch window allows you to strip away the noise. By defining specific expressions or variables to "watch," you create a focused view of the data that matters most.
Think of it as a dedicated dashboard for your program's state. Whether it's a counter in a complex algorithm or a flag that dictates branch logic, watch expressions update automatically as your code executes.
Configuring Watch Expressions: A Worked Example
Imagine we are debugging a function that calculates the total price of items in a cart. We suspect that our tax calculation logic is intermittently returning an incorrect value due to a floating-point precision error.
JAVASCRIPTfunction calculateTotal(items, taxRate) {
    let total = 0;
    for (let i = 0; i < items.length; i++) {
        let itemPrice = items[i].price;
        // Logic error: tax applied incorrectly to individual items
        let tax = itemPrice * taxRate;
        total += (itemPrice + tax);
    }
    return total;
}
To debug this, we don't want to step through every single iteration. Instead, we perform state tracking:
- Set a Breakpoint: Place a breakpoint inside the
forloop, right after thetaxcalculation. - Add to Watch: Right-click the
taxvariable (or the expressionitemPrice * taxRate) and select "Add Watch." - Monitor: As you resume execution (press "Continue" or "Play"), the watch window will update the value of
taxfor every item in the array.
If the tax value suddenly jumps to an unexpected number (like NaN or an absurdly high value), you’ve immediately identified the point of failure.
Hands-on Exercise
Using the project we established in setting up the project environment, find a loop in your current codebase that processes a list of objects.
- Identify a variable inside that loop that changes every iteration.
- Add that variable to your IDE's watch window.
- Add a conditional expression to the watch window, such as
myVariable > 100(which will returntrueorfalse). - Run your debugger and observe how the watch window handles these expressions as the code executes.
Common Pitfalls
- Watching Too Many Expressions: Just like a cluttered desk, a cluttered watch window makes it harder to spot the truth. Keep only the 2-3 most critical variables in view.
- Assuming Scope Persists: If you move outside the function where a watched variable is defined, the watch window will show "Out of Scope" or "Undefined." Don't mistake this for a bug in your logic; it's simply the debugger losing track of that memory reference.
- Neglecting Complex Expressions: You aren't limited to simple variables. You can watch
user.profile.settings.isActive. If the value isundefined, the debugger will often tell you exactly which part of the chain failed.
Frequently Asked Questions
Q: Can I change a variable's value in the watch window? A: Yes! Most modern IDEs allow you to double-click the value in the watch window and type a new one. This is a great way to test "what-if" scenarios without changing your source code.
Q: What if my expression is invalid? A: The watch window will usually show an error icon or "Evaluation Error." This usually means you have a typo or the variables in your expression are not currently accessible.
Q: Is this the same as a log statement? A: No. Logging is passive and permanent; watch windows are active, ephemeral, and don't require you to modify your code or redeploy. They are superior for quick, localized debugging.
Recap
We’ve learned that the watch window is your primary tool for variable monitoring and state tracking. By isolating specific expressions, you cut through the noise of a full execution stack. You can now use these tools in tandem with using ide breakpoints to pinpoint bugs with surgical precision.
Up next: We will learn how to interpret stack traces to identify the exact file and line number of an error.
Work with me
React & Next.js Dashboard / Admin UI Development
A clean, data-rich dashboard UI in React or Next.js — charts, tables, and real-time data that your users will actually enjoy using.
Next.js E-commerce Store Development
Turn your Facebook page or small shop into a real online store — fast, mobile-first, and built to sell. Own your storefront, not just a social page.