Debugging Techniques: Mastering Browser Dev Tools for JS
Master essential debugging techniques in JavaScript by learning to use breakpoints, the debugger statement, and the Network tab to fix bugs faster.
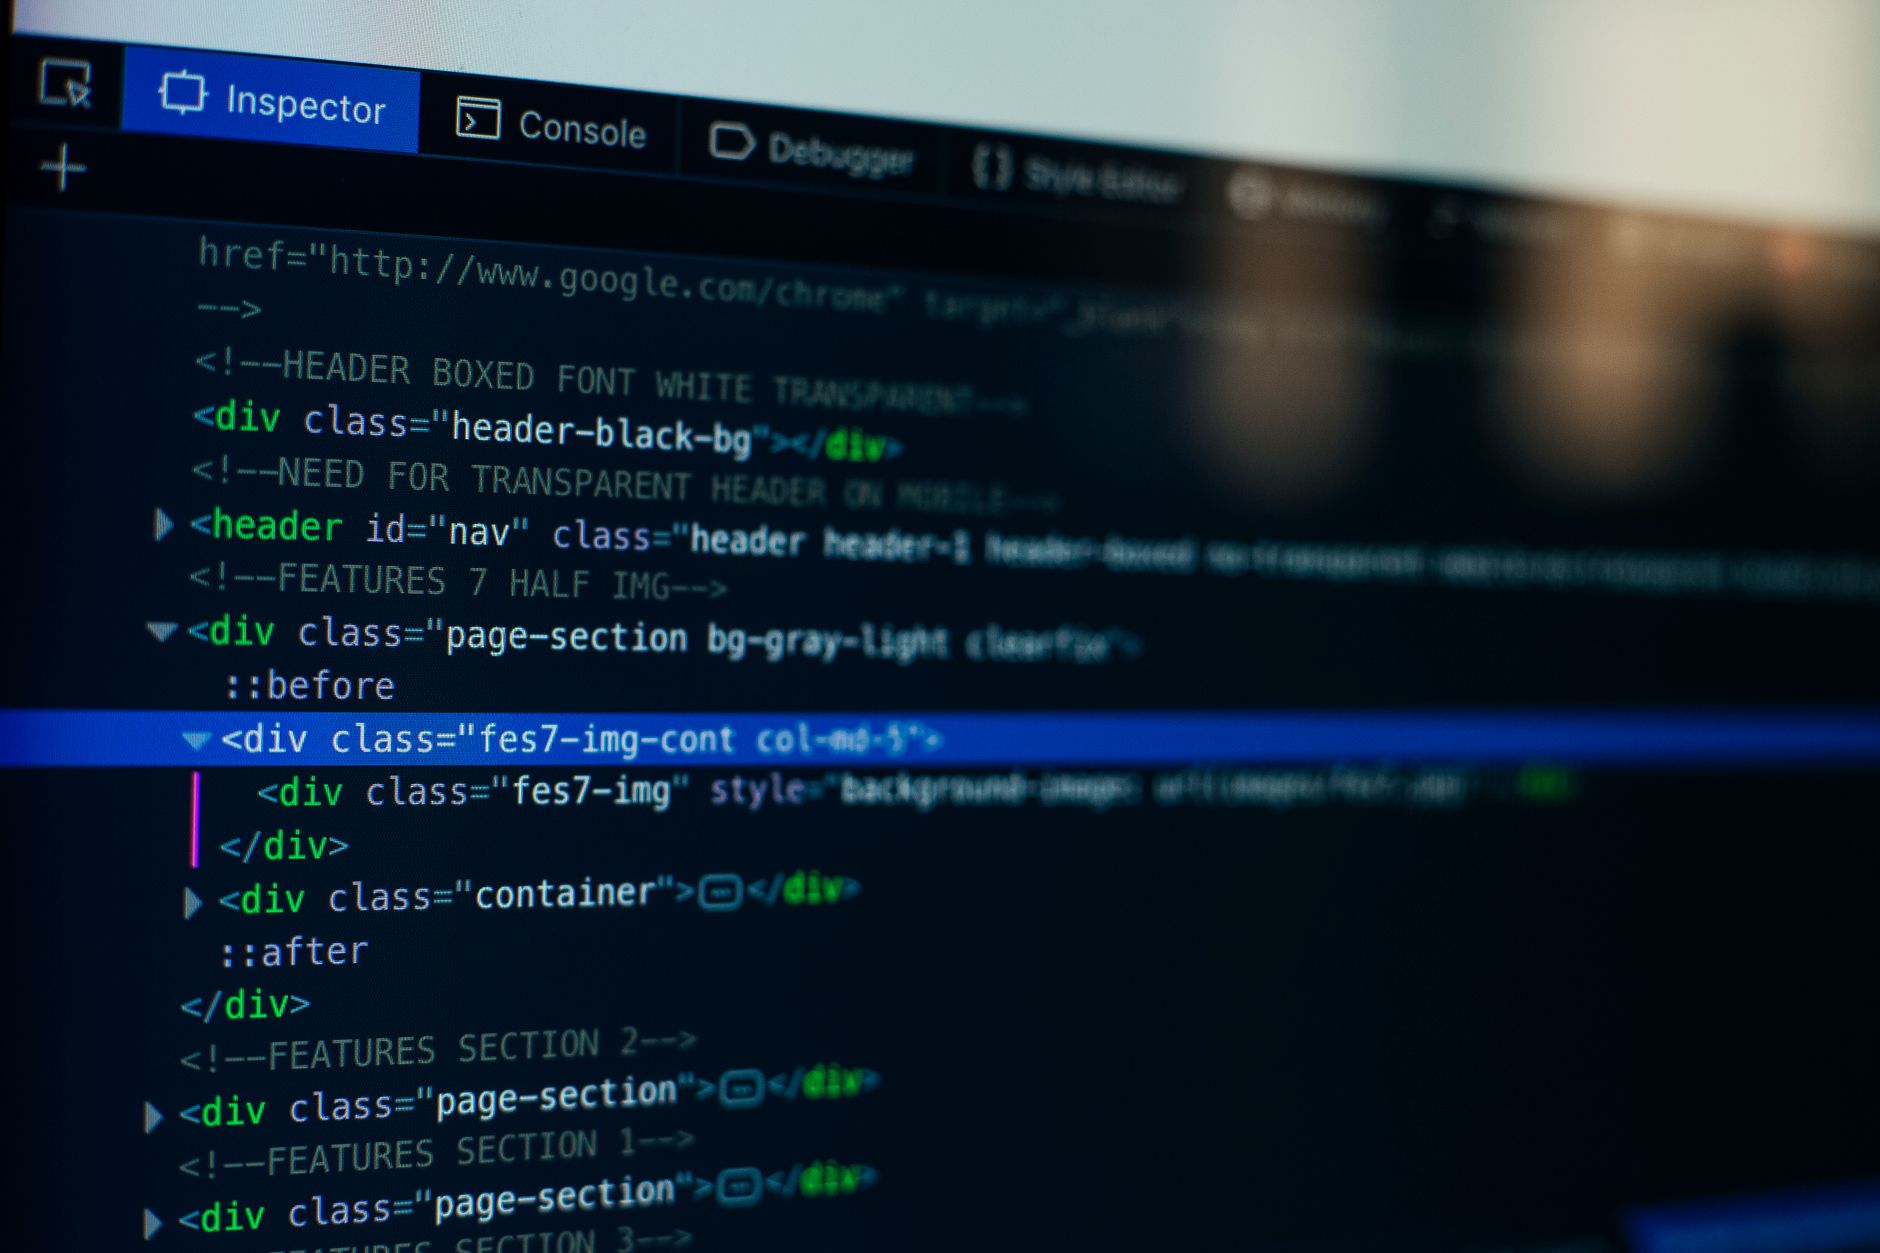
Previously in this course, we focused on cleaning up the global namespace to prevent variable collisions. While organized code is easier to maintain, bugs are inevitable; this lesson teaches you how to systematically identify and resolve them using browser developer tools.
As a frontend engineer, you shouldn't rely solely on console.log. While logging is useful for a quick check, professional debugging requires tools that pause execution and let you inspect the entire environment.
The Power of Breakpoints
A breakpoint tells the browser to pause your code execution at a specific line. Once paused, you can "step through" your code line-by-line, watching exactly how your variables change.
- Open your browser's DevTools (F12 or Right-click > Inspect).
- Navigate to the Sources tab.
- Find your JavaScript file in the file navigator on the left.
- Click on a line number to set a blue marker—this is your breakpoint.
When you trigger the functionality (e.g., clicking your "Add Task" button), the browser will freeze. You’ll see the values of variables in the "Scope" pane on the right. You can now hover over any variable in your code to see its current value without needing to refresh or log it to the console.
The debugger Statement
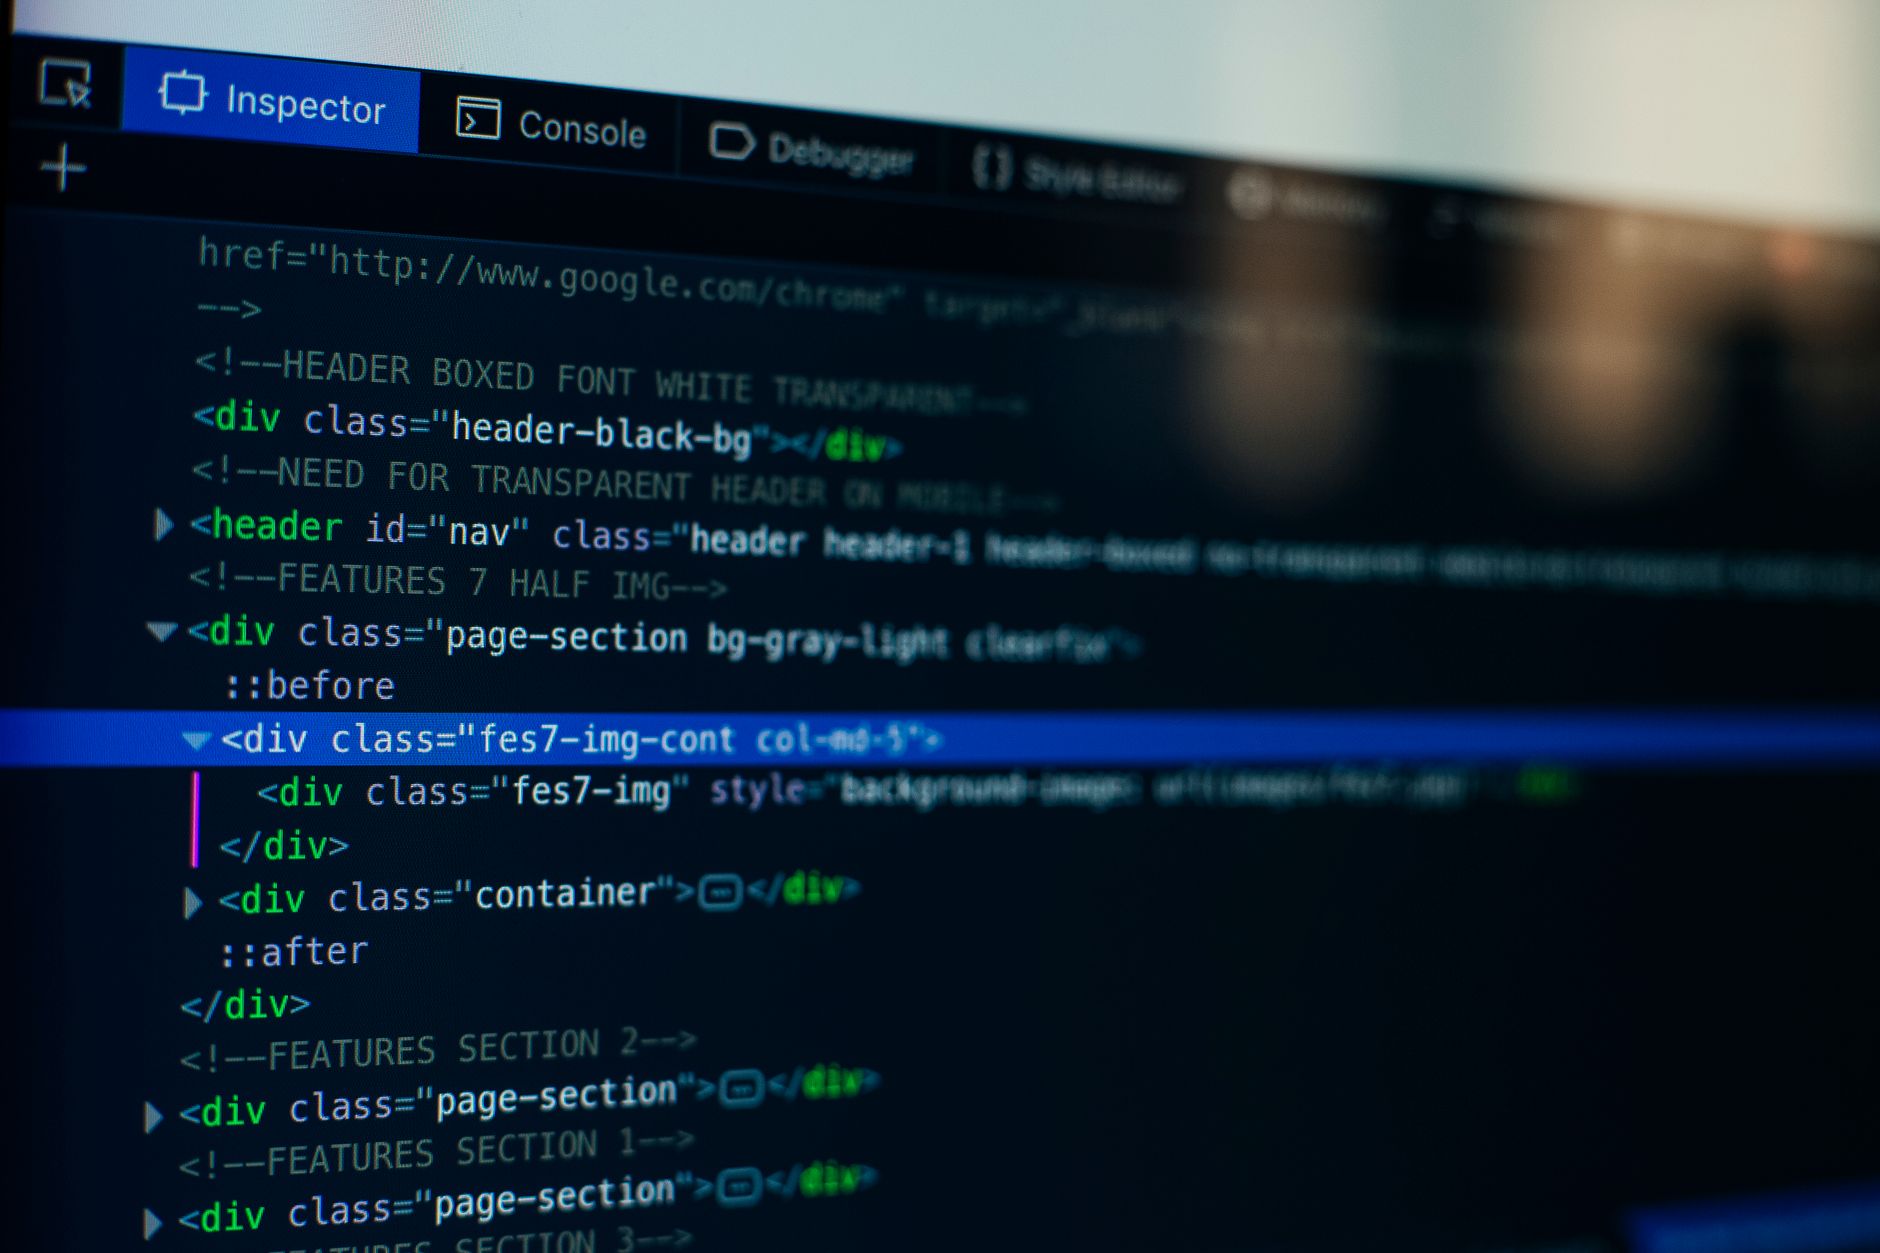
Sometimes, you want to trigger a pause programmatically without navigating through the UI to set a breakpoint. You can insert the debugger; keyword directly into your JavaScript source code:
JAVASCRIPTfunction addWeatherToDashboard(city) {
  debugger; // Execution will pause right here!
  const weatherData = fetchWeatherData(city);
  // ... rest of the logic
}
When the browser encounters this line, it acts exactly as if a manual breakpoint was set. This is incredibly helpful for interpreting stack traces when you need to inspect a specific logical branch that is hard to reach manually.
Inspecting Network Traffic
Since our project relies on fetching data from weather APIs, often the "bug" isn't in your code, but in the data coming back from the server.
The Network tab is your command center for troubleshooting API requests:
- Status: If you see a 404 or 500 error, your request is failing before your code even processes the result.
- Payload: Look at the "Response" tab to see exactly what the API sent. If you're struggling with parsing JSON, this is where you verify the structure of the data.
- Headers: Check if your API keys or authorization headers are being sent correctly.
| Tool | Purpose | Best Used For |
|---|---|---|
| Console | Logging | Quick status checks and simple variable outputs. |
| Sources | Breakpoints | Stepping through logic and inspecting local scope. |
| Network | Traffic Audit | Diagnosing API failures and inspecting server payloads. |
Hands-on Exercise: Debugging the Dashboard
In our running project, let's locate the weather fetch function.
- Place a
debugger;statement inside yourasyncweather fetch function. - Open the Network tab and clear the current logs.
- Trigger a weather search and observe the request in the Network tab.
- Once the code hits your
debugger;statement, inspect theresponseobject in the Scope pane. Ensure the temperature data exists before you attempt to render it to the DOM.
Common Pitfalls
- Leaving
debuggerin production: Always remove or comment outdebugger;statements before pushing code to a live site. - Ignoring the "Pause on Exceptions" button: In the Sources tab, there is a small icon that looks like a pause button. If this is active, the browser will automatically pause whenever an error occurs. This is the most effective way to catch hidden bugs.
- Forgetting to refresh: If you edit your code in your text editor, ensure you save the file and refresh the browser; DevTools won't see your changes until the page reloads.
If you find your styles are behaving unexpectedly during this process, remember you can also use these tools for debugging Tailwind styles by inspecting computed CSS properties in the Elements panel.
FAQ
Q: My code doesn't pause at the debugger statement. Why?
A: Ensure your Developer Tools window is actually open. If the DevTools console is closed, the browser ignores debugger statements to avoid interrupting the user experience.
Q: Can I modify variables while the code is paused?
A: Yes! Use the Console tab while execution is paused to overwrite variables (e.g., type weather = 30; in the console) to test how your UI reacts to different data without changing the source code.
Recap

Effective troubleshooting relies on visibility. By utilizing breakpoints in the Sources tab, the debugger statement for precise control, and the Network tab for API verification, you transform from guessing what your code is doing to knowing exactly what it is doing.
Up next: We will perform a final audit of our project, ensuring all debug statements are removed and the code is structured cleanly for deployment.
Work with me
Next.js Full-Stack Web App Development
A fast, SEO-ready full-stack web app built with Next.js 16 — from idea to deployed product, by an engineer who ships to production.
Laravel Bug Fixes, Maintenance & Optimization
Stuck on a Laravel bug or a slow app? Fast, reliable fixes, upgrades, and performance tuning from an experienced Laravel engineer.